Green is the new black

How can tyre choice impact on CO2 emissions? That’s what a ground-breaking new study set out to discover. We have the exclusive story
Experts agree that tackling climate change attributed to CO2 emissions from transporting road freight is paramount. The Euro emission standards have been a great initiative, but more needs to be done, for example, optimising routes, reducing weight, aerodynamic fairings, driver-training, alternative fuels and electrification.
These all have varying levels of effectiveness and barriers to mainstream acceptance, including capital costs, government regulation or higher technical knowledge requirements.
Working together
Obviously, even the most innovative and seemingly effective intervention to reduce CO2 emissions is impractical if it puts the road transport operator out of business. How do we determine which are the best interventions? Getting all road transport industry sectors working together to reduce CO2 emissions is the goal of the Centre for Sustainable Road Freight-South Africa (SRF-SA).
Green tyres
Low rolling resistance tyres (green tyres) could reduce road transport fuel consumption and CO2 emissions, and thereby justify their shorter lifespan. The choice of tyre should also include the cost of CO2 emissions to society. This has been mostly ignored, but carbon taxes, an increased social awareness and the threat of trial by social media are driving decarbonisation efforts.
How much do low rolling resistance tyres actually save on fuel costs and CO2 emissions? Measuring fuel consumption is dependent on many variables, such as driver behaviour, wind speed, vehicle maintenance and wheel alignment, so a controlled trial is needed.
Put to the test
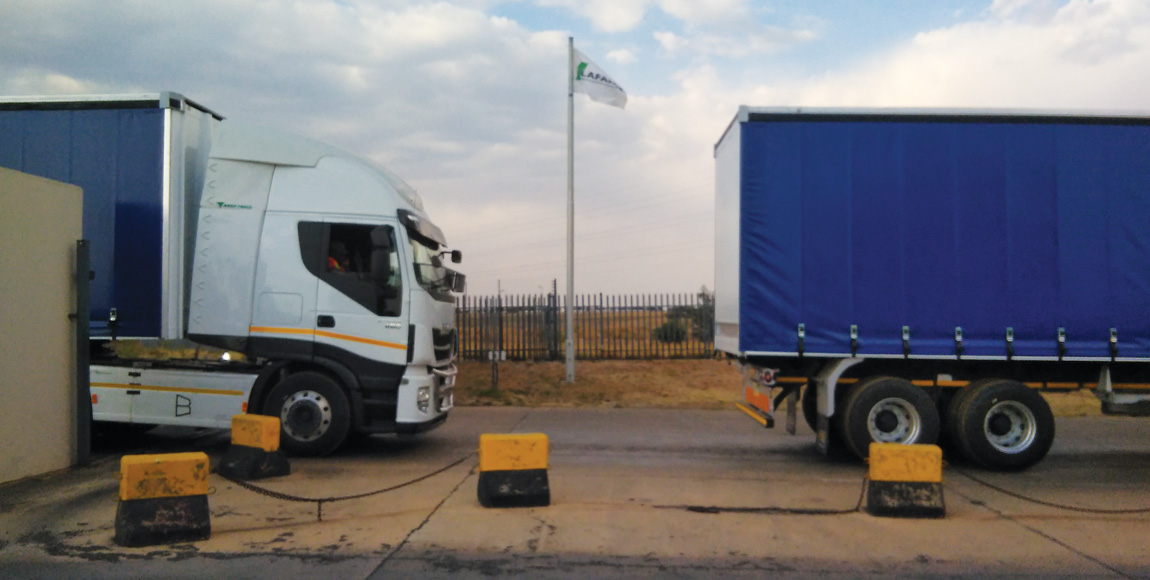
At the Gerotek Test Facilities in Pretoria, the SRF-SA conducted a comparison of low rolling resistance tyres versus conventional black tyres. Two Stralis AS750S48TZP Hi-Way 6×4 truck tractors (with similar mileage) were provided by Iveco, and Afrit provided two new T6 sliding-curtain tautliners.
Michelin funded the study and provided the control tyres, the X Multi, on vehicle A and the low rolling resistance tyres, the X Line Energy, on vehicle B. The diesel was supplied by Total SA.
Next, 17 pallets of cement bags from Lafarge were loaded onto each vehicle. On the first day, the trucks were run for eight hours at 80 km/h, two hours at a time, with 10- to 20-minute breaks in between, according to international best practice.
The switch
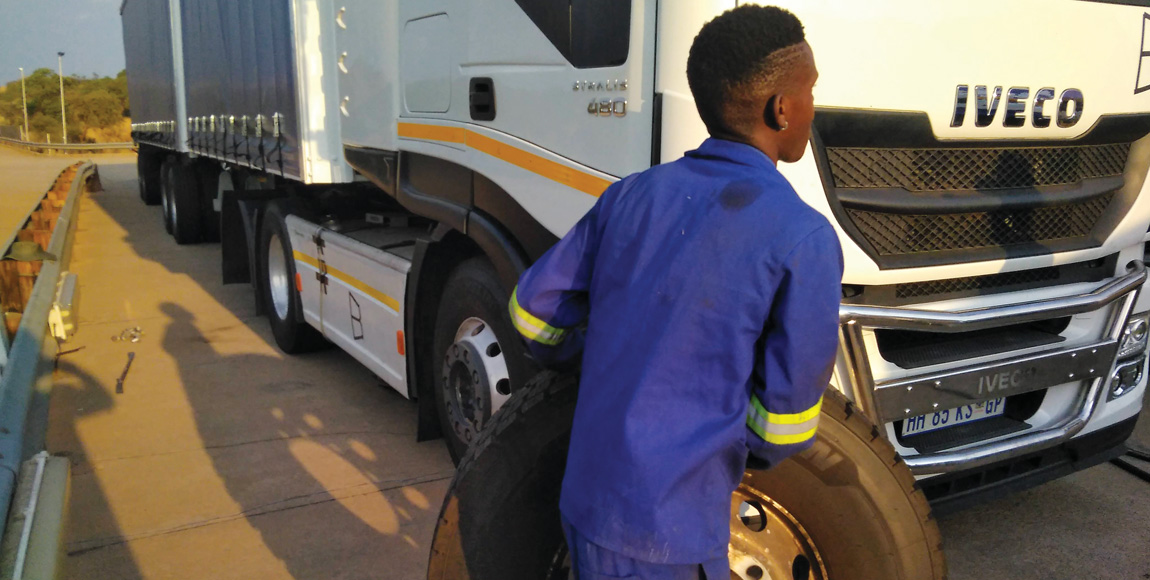
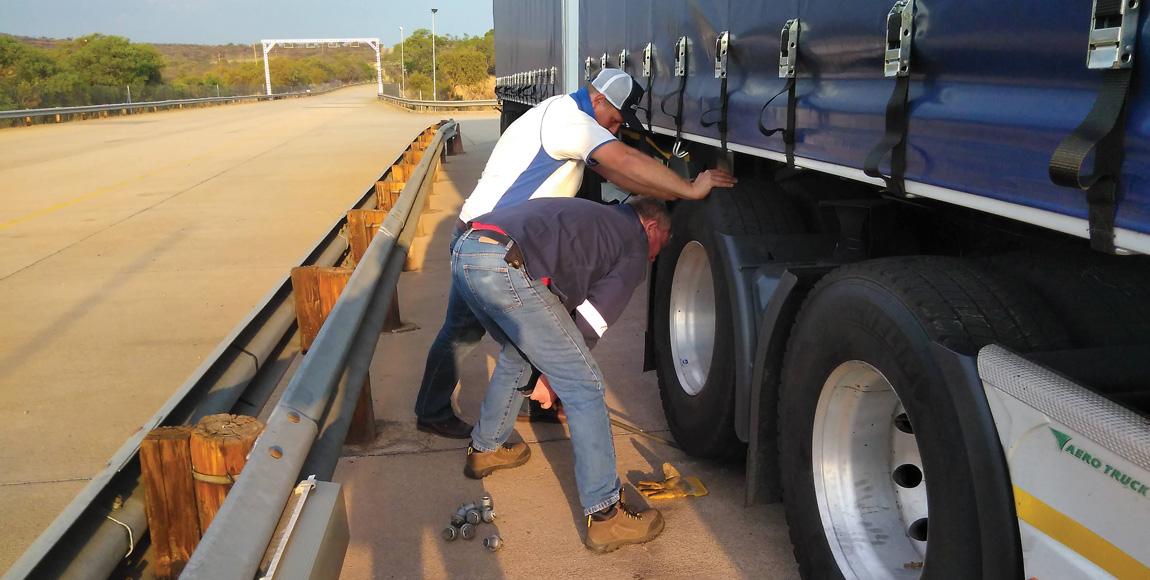
After simulating a full day’s work transporting freight, the green tyres on vehicle A were fitted onto vehicle B and the black tyres on vehicle B were fitted onto vehicle A. The drivers were continually changed after each two-hour session. The wheel alignment and tyre pressures were checked throughout the testing, and the tyre wear was monitored from beginning to end.
Measuring and monitoring
The SRF-SA is based on and linked to the Centre for Sustainable Road Freight (SRF) in the United Kingdom (UK) – a collaboration between Cambridge, Heriot-Watt and Westminster Universities and UK companies.
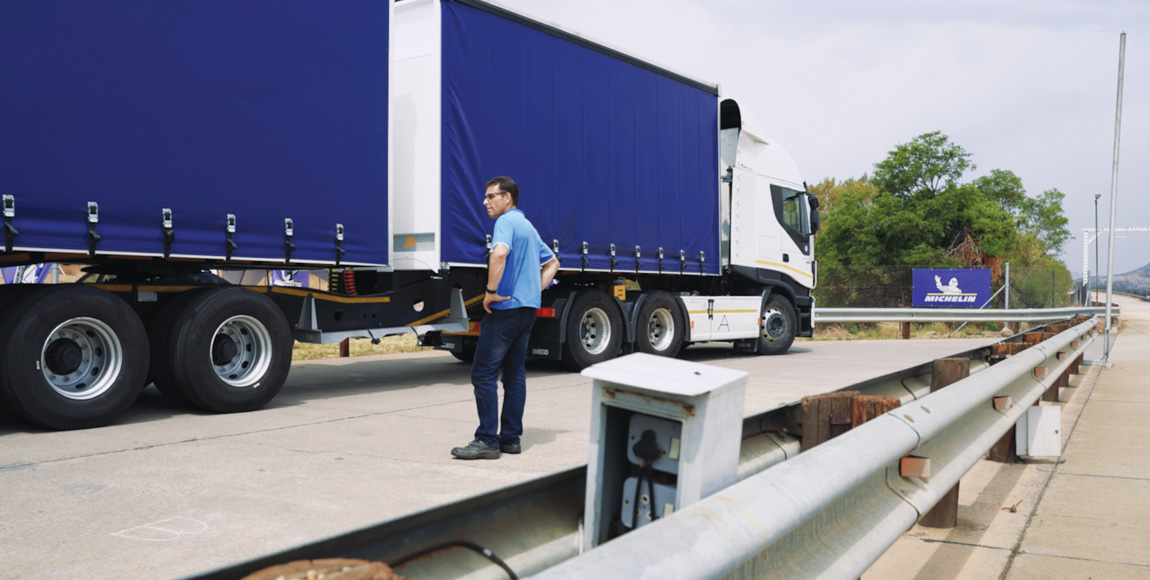
Expert fuel consumption monitoring was undertaken by Dr Xiaoxiang Na from Cambridge University, who programmed two loggers to tap into the vehicle CAN bus. The loggers recorded GPS data, CAN data from the engine (engine rpm, engine torque, fuel use, fuel rate, accelerator position, gear, brake/clutch/cruise control status, vehicle speed and odometer) and logged into the nearest weather station to record the ambient wind speed and direction, as well as ambient temperature.
Measurements of the drive tyre temperature were logged using infrared sensors. The most important fuel rate readings came from the CAN bus, and were further verified using fuel pump data.
The difficulty in using fuel pump measurements for fuel consumption is ensuring that the fuel is filled up to exactly the same level after each test. Martin Dammann from TruckScience suggested the use of a PVC tube, which was expertly fitted by the ELT workshop in Turffontein, as a sight glass.
The result
The CAN bus was checked at the start and end of each two-hour session to determine the amount of fuel used and to calculate the fuel consumption. The improvement in fuel consumption due to the X Line Energy tyres was between 8,0 and 9,8 percent (See Table 1). Weather and track conditions were not responsible for this, as the two vehicles ran at the same time on the same track.
The results were not due to a difference in the vehicles, as the wheels were also swapped after the first day’s testing, and the improvement was seen after the tyre change. The drivers were changed after each session and were, therefore, also not responsible for the results.
Furthermore, the fuel consumption improvement was calculated using the fuel pump data and confirmed the CAN bus results with measurements between 8,7 and 10 percent (See Table 1). Readings were obtained after every second session, as the trucks were refuelled at midday and in the evening. A sight glass error occurred on vehicle B in the evening, as the PVC pipe fixed to the side of the tractor with duct tape shifted, due to the tape glue melting in the extreme heat.
They’re cooler!
The increase in tyre temperature above the ambient temperature is shown for the X Line Energy and X Multi tyres in Table 2. The X Line Energy tyre ran consistently cooler than the X Multi tyre. This is expected as the green tyre dissipates less energy, which results in a reduced increase in tyre temperature.
They reduce fuel consumption
The X Line Energy ran 29-percent cooler on average than the X Multi tyre. Assuming that 33 percent of the energy losses in the trucks are due to rolling resistance (a reasonable estimate based on work by world trucking experts) and that the increase in tyre temperature is proportional to the energy dissipated due to rolling resistance, then the X Line Energy tyre will use 9,6-percent less fuel.
In summary, fuel consumption measurements using the CAN bus, fuel pump and tyre temperature, on a fully loaded superlink operated at 80 km/h, show that the X Line Energy tyre reduces fuel consumption over the X Multi tyre by at least eight percent.
Overall profit impact
Tyre purchase is very often driven by the tyre cost per kilometre. The tyre purchase manager can easily calculate the lifespan of a tyre model, and knows the tyre purchase price. The effect of tyre choice on fuel consumption is, however, far more critical and is often not taken into account when making a purchase decision.
The key is in understanding the overall profit impact. Because road transport profit margins are so low and fuel costs so high, an eight-percent improvement in fuel consumption has a massive effect on the bottom line of a road transport operation.
Professor Jan Havenga, of the SRF-SA, estimates that average profit margins in South Africa are around four percent and fuel costs make up 40 percent of the total costs of a road transport operation.
Therefore, it can be shown that even if the X Line Energy tyres have a reduced lifespan of 25 percent compared to the X Multi tyre, profits will be increased by 40 percent. A 40-percent profit increase and a conservative eight-percent CO2 reduction makes running X Line Energy tyres a no-brainer on long-haul transport vehicles that don’t go off road.
Vehicle and tyre maintenance coupled with regular wheel alignment and the correct inflation pressures, are key to extracting the full advantage of green tyres and optimising your fuel savings.
The SRF-SA is a recent collaboration between the University of the Witwatersrand, Stellenbosch University, The Council for Scientific and Industrial Research (CSIR), the University of the Western Cape, and Tshwane University of Technology, as well as industry players Michelin and Transnet. More industry players are needed though, especially truck original equipment manufacturers, trailer manufacturers, fuel suppliers and logistics companies.
Table 1 Fuel Consumption Test Results
|
Thursday, Oct 24 |
Friday, Oct 25 |
|||||||
|
Session 1 |
Session 2 |
Session 3 |
Session 4 |
Session 1 |
Session 2 |
Session 3 |
Session 4 |
|
|
CAN data measurement |
8,0% |
9,0% |
9,8% |
8,1% |
8,0% |
9,3% |
9,3% |
9,2% |
|
Fuel pump measurement |
8,7% |
Sight glass error |
10,0% |
8,6% |
Table 2 Increase in Tyre Temperature above Ambient Temperature
|
Thursday, Oct 24 |
Friday, Oct 25 |
|||||||
|
Session 1 |
Session 2 |
Session 3 |
Session 4 |
Session 1 |
Session 2 |
Session 3 |
Session 4 |
|
|
Green Tyre |
13,8°C |
20,9°C |
22,1°C |
20,3°C |
17,0°C |
17,7°C |
17,3°C |
15,8°C |
|
Black Tyre |
25,4°C |
29,9°C |
31,3°C |
29,1°C |
22,2°C |
23,4°C |
22,3°C |
20,8°C |
Published by

focusmagsa


