The 2021 annual report from DriveRisk – a pioneer in on-road behavioural risk monitoring and driver sciences for over 22 years – highlights some of the most prevalent risky driving behaviours, allowing fleet operators to target specific poor behaviours to improve safety.
Founded in 2000, DriveRisk services customers in 24 countries across multiple industry sectors. The data displayed in the report represent over 12,5 million 12-second exception-based video events captured from over 50 000 active devices. Events are triggered by various mechanisms, including accelerometer readings, Machine Vision and Artificial Intelligence (AI), devices for monitoring fatigue, and advanced driver-assistance systems (ADAS). Each event is comprehensively reviewed and analysed to produce a risk score.
DriveRisk tools actively monitor and manage risky behaviours that lead to collisions and other incidents or potential incidents, capturing more than 28 000 different behaviours per day and identifying a total of over 10,5 million behaviours.
According to the report, the most prevalent risky behaviours are driving unbelted (1,96 million events) and distracted driving (more than 1,35 million events, of which 814 000 related to handheld cellphones). In terms of behavioural outcomes, 3 683 collisions, 13 214 avoidable near collisions, and 18 475 unavoidable near collisions were logged. Collisions are most common from 06:00 to 09:00 and 15:00 to 18:00, while the leading near collision-related behaviours recorded were intersection awareness, late response, mirror use, cellphone distractions, and eating and drinking.
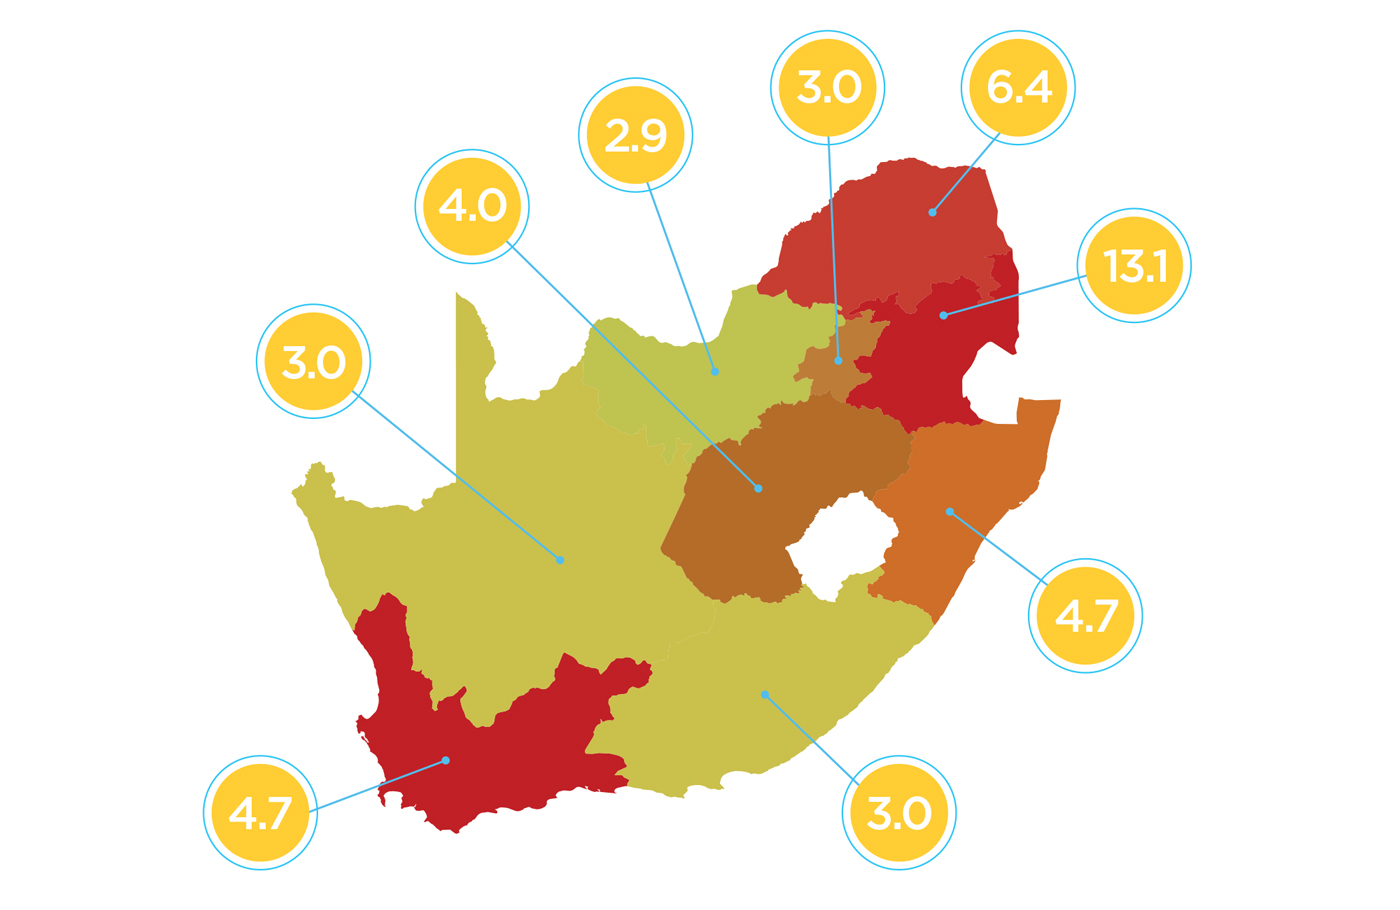
The report finds that the riskiest province to drive in was, by a significant margin, Mpumalanga, which returned an event risk score of 13.1, more than double the score of the second-riskiest province, Limpopo (6.4). Values represent the average risky events per vehicle in 2021, normalised per vehicle to provide an accurate reflection of where the highest risk events occur. The report also provides a detailed breakdown of times when specific industries are most at risk.
DriveRisk’s data collection and visualisation tools enable meaningful, risk mitigating dialogue between fleet operators and drivers, contributing to better road safety within transport and logistics fleets and South Africa as a whole. “The ongoing development of our data warehouse and Business Intelligence is aimed at equipping our clients, and our staff, to use data as a tool versus a by-product of rolling out risk mitigation technology,” says a DriveRisk data scientist.
While these tools can provide immediate benefits, it is only possible to correct behaviours and maintain and manage sustainable behavioural change by continuing to engage constructively with those who are ultimately responsible for on-road behaviour – the drivers.
DriveRisk’s award-winning driver safety programme has coached over 550 000 drivers from more than 700 companies, helping to correct many common risk factors. “Our core focus is understanding the behavioural risks of drivers, highlighting these risks to our customers, and providing the mechanism for behaviour change through our driver coaching workflow,” explains Clay Colegate, chief business development officer at DriveRisk.
More than 60 individual driving behaviours are combined into overarching behaviour groups. This level of granularity provides fleet operators with actionable insights to promote risk-based conversations with specific drivers regarding exact concerns.
“We are committed to reducing the on-road risk exposure of our customers… Not only do our customers absolutely understand their risk, but (they) are also aware of how they rank against their peers in their industry,” adds Colegate.
The data gathered by DriveRisk’s technology has exposed fleet operators to a rich source of data, enabling them to make better-informed risk-based decisions and prevent unwanted and risky incidents. “Our vision for 2022 is not only to provide our customers with deeper and richer insights that will change the way in which we understand our risks, but to provide immediate visibility through our BI,” notes Colgate.